![55 Intriguing Graphic Design Statistics [2022]](https://cdn.shopify.com/s/files/1/1718/9213/files/55-intriguing-graphic-design-statistics-2022.jpg?v=1691987220) If you have a flair for creating eye-catching designs and are looking for a job that can do double-duty as a creative outlet, graphic design might just fit the bill. Graphic designers convey information through photos and art, creating visuals for everything from websites and book covers to posters, print ads, and more. While the industry outlook is one of slow growth, that doesn’t mean there aren’t still opportunities to enter the field—in fact, nearly 25,000 of them are projected to become available each year throughout the next decade. The good news is that nearly every company needs a graphic designer on its team. Attractive visual marketing materials are a necessity for most businesses, as are well-designed web pages, social media pages, and more. And keep in mind that a graphic design career offers options. You don’t have to become a full-time graphic design employee at a company; as you’ll see in the statistics below, plenty of designers choose to work on a freelance basis or even part-time. Another fun fact about graphic design is that it offers tons of avenues to explore: illustrator, animator, layout artist, website designer, UX designer, etc. You can essentially build your career in the way that works best for you. If you’re considering graphic design as a career, start by perusing the graphic design statistics below to learn more about the industry and the work.
If you have a flair for creating eye-catching designs and are looking for a job that can do double-duty as a creative outlet, graphic design might just fit the bill. Graphic designers convey information through photos and art, creating visuals for everything from websites and book covers to posters, print ads, and more. While the industry outlook is one of slow growth, that doesn’t mean there aren’t still opportunities to enter the field—in fact, nearly 25,000 of them are projected to become available each year throughout the next decade. The good news is that nearly every company needs a graphic designer on its team. Attractive visual marketing materials are a necessity for most businesses, as are well-designed web pages, social media pages, and more. And keep in mind that a graphic design career offers options. You don’t have to become a full-time graphic design employee at a company; as you’ll see in the statistics below, plenty of designers choose to work on a freelance basis or even part-time. Another fun fact about graphic design is that it offers tons of avenues to explore: illustrator, animator, layout artist, website designer, UX designer, etc. You can essentially build your career in the way that works best for you. If you’re considering graphic design as a career, start by perusing the graphic design statistics below to learn more about the industry and the work.
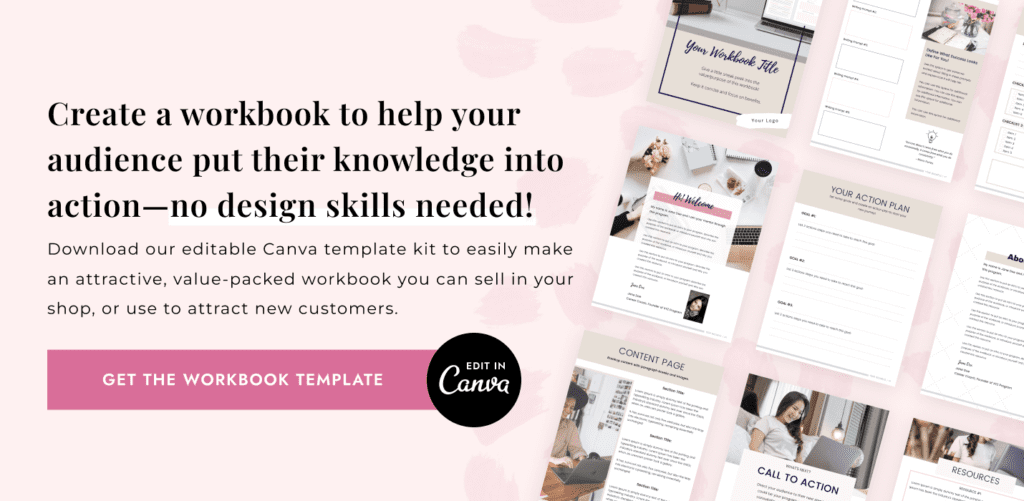
Need new offerings for your website visitors or Etsy store shoppers? Create a value-packed workbook in a snap with these easy-to-use, editable Canva templates.
55 Compelling Graphic Design Statistics
Graphic Design Industry Statistics
Creativity is crucial for graphic design, but so is an understanding of computer graphics and design software. That’s why most graphic designers have a bachelor’s degree from an accredited college or university, where they can learn about the latest technology tools as well as about design principles and trends. Once you’re armed with the right degree, it’s a matter of gaining experience. Take a look at the graphic design facts below to see what you can expect as a worker in this industry.
- Globally, the graphic design market was worth $45.8 billion in 2021. (IBISWorld, 2021)
- The current market for graphic design is worth $15 billion in the United States alone. (SaaS Scout, 2020)
- Logo designing and branding accounts for around $3 billion of that market. (SaaS Scout, 2020)
- On average, the annualized market-size growth of graphic design usually falls around 2.8%; the market grew by a massive 4.1% in 2021. (IBISWorld, 2021)
- IBISWorld also found that logo design and branding made up around $3 billion of the total market. (IBISWorld, 2021)
- The number of businesses in the U.S. graphic and design industry as of June 2019 was 16,823. (IBISWorld, 2020)
- Globally, there were 400,258 businesses in the graphic design industry in 2020. (IBISWorld, 2020)
- The average graphic designer earns around $53,380 per year. (Bureau of Labor Statistics, 2022)
- Web/graphic designers earn an average of $59,000 per year. (Glassdoor, 2021)
- The average hourly wage for graphic designers is $26. (ZipRecruiter, 2021)
- Freelance graphic designers earn $20 to $150 per hour. (Eksposure, 2020)
- The total number of jobs reported in the U.S. for graphic designers in 2019 was 281,500. The number of professionals in the industry seems to be declining. (Bureau of Labor Statistics, 2022)
- The graphic design industry growth rate during the 2019 to 2029 period is predicted to decline by 4%. This means the industry will lose around 10,700 jobs during said period. (Bureau of Labor Statistics, 2019)
- The employment of graphic designers in directory, book, periodical, and newspaper publishers is expected to decline by 4% from 2019 to 2029. (Bureau of Labor Statistics, 2019)
- On the other hand, the employment of graphic designers in the computer systems design field and related areas will increase by 20% from 2016 to 2026. (Bureau of Labor Statistics, 2019)
- In the U.S. alone, the total percentage change in employment is projected to be 7%. The percentage of change in graphic design employment is projected to be 4% over the same period. (Bureau of Labor Statistics, 2019)
- Most graphic designers are employed in the area of specialized design services (19.12%). (Bureau of Labor Statistics, 2019)
- The average age for workers in the graphic design field is 40.5. (Eksposure, 2020)
- For male graphic designers, the median age is 41.3. (Eksposure, 2020)
- For female designers, the median age is 39.8. (Eksposure, 2020)
- Currently, freelance graphic designers account for around 90% of industry participation. The number of employees working freelance in graphic design is likely to increase. (IBIS World, 2021)
- There are approximately 172,081 graphic designers working for businesses in an industry with about 3.6% annual growth. (PRINT, 2019)
- If you are hiring an agency, you can expect them to charge anywhere from $500 to $2,000 per infographic. An infographic-focused agency could charge even more. (Eksposure, 2020)
- In terms of hours spent creating visuals, 28% of digital marketers spend less than two hours every week. Additionally, 22% spend 2-5 hours, 22% spend 5-10, 9% spend 10-15 hours, and 11% spend more than 15 hours every week. (Venngage, 2020)
- 67% of small businesses are willing to pay $500 for a logo. (SaaS Scout, 2020)
- A light and simple logo design could cost between $100 and $200; a more long-lasting, quality design for a business would cost anywhere from $300 to $1,300. (Eksposure, 2020)
- For a banner, the price can vary between $50 (low) to $350 (high). (Eksposure, 2020)
- Designing a catalog can cost $125 to $300 per page. (Eksposure, 2020)
- Having your ebook manually arranged by a professional can cost anywhere from $200 to $2,500. (Eksposure, 2020)
Website & Social Media Graphic Design Statistics
A company’s website design is crucial for lots of reasons, good navigability and a positive brand perception among them. Research has shown that it also plays a role in credibility—46% of respondents in one survey cited design as one of the top criteria when evaluating a company’s trustworthiness. The same goes for blogs, social media pages, and other types of company content. All these assets must be on-brand and eye-catching to engage readers. Some digital marketers have access to an in-house graphic designer to help communicate marketing messages, but others—about 15%—rely on freelance graphic designers to satisfy their needs. If you’re interested in designing and developing company websites and content, here are some interesting design statistics that may help prepare you for the job:Websites
- 94% of consumers leave a website they perceive to be poorly designed. (GraphicsZoo, 2020)
- A basic website with a few pages can cost around $1,000 to $10,000. A site with a few hundred pages can cost $15,000 to $100,000. (Eksposure, 2020)
- Websites are being created at a rapid pace. In 2010, there were a little over 210 million websites. Today, there are over 1.8 billion. (Internet Live Stats, 2022)
- A Venngage study found that companies considered original graphics to be the ones most likely to help them reach their marketing goals. 40.8% of people said these tools were effective at generating conversions. 40.8% also said stock photos did not help them reach their goals. (Venngage, 2022)
- Video is becoming an increasingly important part of the graphic design environment. According to Wyzowl, around 84% of customers agreed that access to promotional videos has helped them make a purchase. (Wyzowl, 2022)
- Venngage’s study found 36.7% of companies consider producing engaging visual assets consistently as their biggest challenge. (Venngage, 2022)
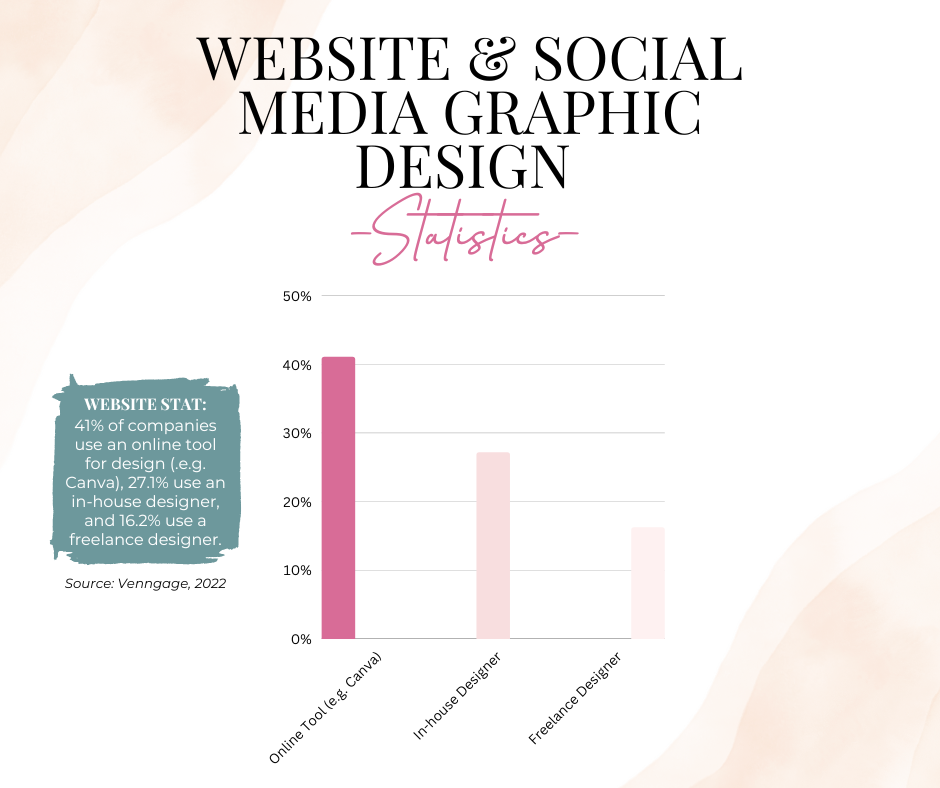
- 41% of companies use an online tool for design (.e.g. Canva), 27.1% use an in-house designer, and 16.2% use a freelance designer. (Venngage, 2022)
Content Marketing

- 60.8% of marketers claim that the visual element is an integral part of marketing. (SaaS Scout, 2020)
- While 40% of companies say their marketing strategies rely heavily on visual content, 36% of companies produce visual content less than two times per week. (Venngage, 2022)
- A content marketing report from HubSpot discovered video is the number one form of media in today’s average content strategy—more popular than blogs and ebooks. The top most valuable content types overall were video at (#1), ebooks and blogs at (#2 and #3), and infographics (#4). (HubSpot, 2020)
- 83% of survey respondents said that video helped them increase the amount of time visitors spend on their page. Additionally, 94% of business leaders believe that video has helped to increase user understanding of their product, while 84% believe it increases leads. (Wyzowl, 2022)
- A study by the Content Marketing Institute found that infographics have had the fastest growth among B2B companies; 67% of companies are using infographic production today. (Content Marketing Solutions, 2020)
- An infographic can cost anywhere from $100 to $300 if it’s made by a freelance graphic designer. However, that doesn’t guarantee a high-quality product. (Eksposure, 2020)
- 68% of digital marketers have plans in place to increase the use of visual assets in future content activities. (Social Media Examiner, 2019)
- On average people retain 65% of the information viewed when it is paired with an image. (SaaS Scout, 2020)
- 32% of digital marketers claim visual images are the most important type of content. Blogging comes second at 27%, followed by videos (24%), live video (9%), and podcasting (1%). (Social Media Examiner, 2019)
- 86% of marketers said that 81% of their blog posts contained at least one visual. (Venngage, 2020)
- For 88% of marketers, visuals are a must for 50% of web articles. (GraphicsZoo, 2020)
- As part of an annual survey on content marketing and design best practices, Venngage asked participants which kinds of visuals they were most likely to use in content. Original graphics—like illustrations, branded pictures, and infographics—took the top spot with 32.5% of the votes. Stock photos followed closely behind at 29.5%. (Venngage, 2022)
- An Orbit Media study found that the more visual the content, the better the results. Blogs with one image had a 16% success rate, compared to blogs with 10 images earning a 39% success rate. (Orbit Media, 2022)
- 62% of marketers use visuals for the landing pages of a website or as part of blog content. (Venngage, 2020)
Social Media

- Venngage survey respondents said they primarily create visual content for blogging (35.5%) but also have a strategy for Facebook (19.3%) and Instagram (13.9%). (Venngage, 2022)
- Hootsuite found that 55.6% of Facebook posts created each day are primarily photographic content. Another 22% of the daily stream of content belongs to video. (Hootsuite, 2022)
- 80% of digital marketers say they use visual assets in social media marketing. (Social Media Examiner, 2019)
- 85% of people are attracted to brands that make use of visual graphics. (GraphicsZoo, 2020)
- 43% found consistency in creating engaging visuals to be the biggest challenge. Other challenges include producing great designs (22%), sourcing good data for graphics (22%), and getting wide-enough reach (12%). (Venngage, 2020)
Grow Your Freelance Business With Lead Magnets
If you’re already working as a freelance graphic designer—or you soon hope to be—you know how challenging it can be to run and grow a business. That’s where we come in. Fresh Scribes is here to make your life easier with our collection of lead magnet templates. You have the talent, but creating these offerings from scratch takes time. You can put your own spin on our editable Canva templates and design a helpful workbook or planner for your desired audience in just minutes. If you’re hoping to attract the attention of digital marketers, for example, you could use our templates to create a content calendar, a marketing workbook, or anything else they would find useful. Grow your audience, attract more leads, and generate more income—it’s what we help you do here at Fresh Scribes! Visit our shop to see our template collections.
Sources (A to Z)
Bureau of Labor Statistics, 2022; Bureau of Labor Statistics, 2019; Content Marketing Solutions, 2020; Data Usa, 2022; Eksposure, 2020; Glassdoor, 2021; GraphicsZoo, 2020; Hootsuite, 2022; HubSpot, 2020; IBISWorld, 2021; Internet Live Stats, 2022; Orbit Media, 2022; PRINT, 2019; SaaS Scout, 2020; Social Media Examiner, 2019; Venngage, 2020; Wyzowl, 2022; ZipRecruiter, 2021